Sound Waves
Sound is defined as those variations in air pressure that can be detected by our ears. The variations in pressure are caused by some object vibrating in the air. The energy so released travels outwards from the source as a longitudinal wave. The change from atmospheric pressure as a wave passes a point can be represented by a graph of instantaneous pressure against time: This pressure variation can be measured quantitatively and may be expressed in micronewtons per square metre (µNm-2). It is this pressure variation that is the most useful concept to use in predicting the actions of any sound waves.
Wavelength
The length that a sound wave occupies depends on two things:
the frequency of the vibrations the velocity of the wave through the air
The wavelength is given by the formula:
Frequency Response of the Ear
The range of frequencies to which the ear is sensitive varies between individuals but is generally in the range 20Hz - 20kHz. where:λ (lambda) is the wavelengths is the speed of sound in air (340 ms-1)f is the frequency of source The upper limit is dependant on the age of the person. A child’s response might extend to 20kHz reducing to about 14kHz by middle age. The lower limit is more difficult to define since below 20Hz, the ear begins to resolve the individual variations of pressure rather than perceiving them as a note. Also below about 20Hz, the rest of the body begins to take over from the ears in sensing the changes in pressure.
Loudness
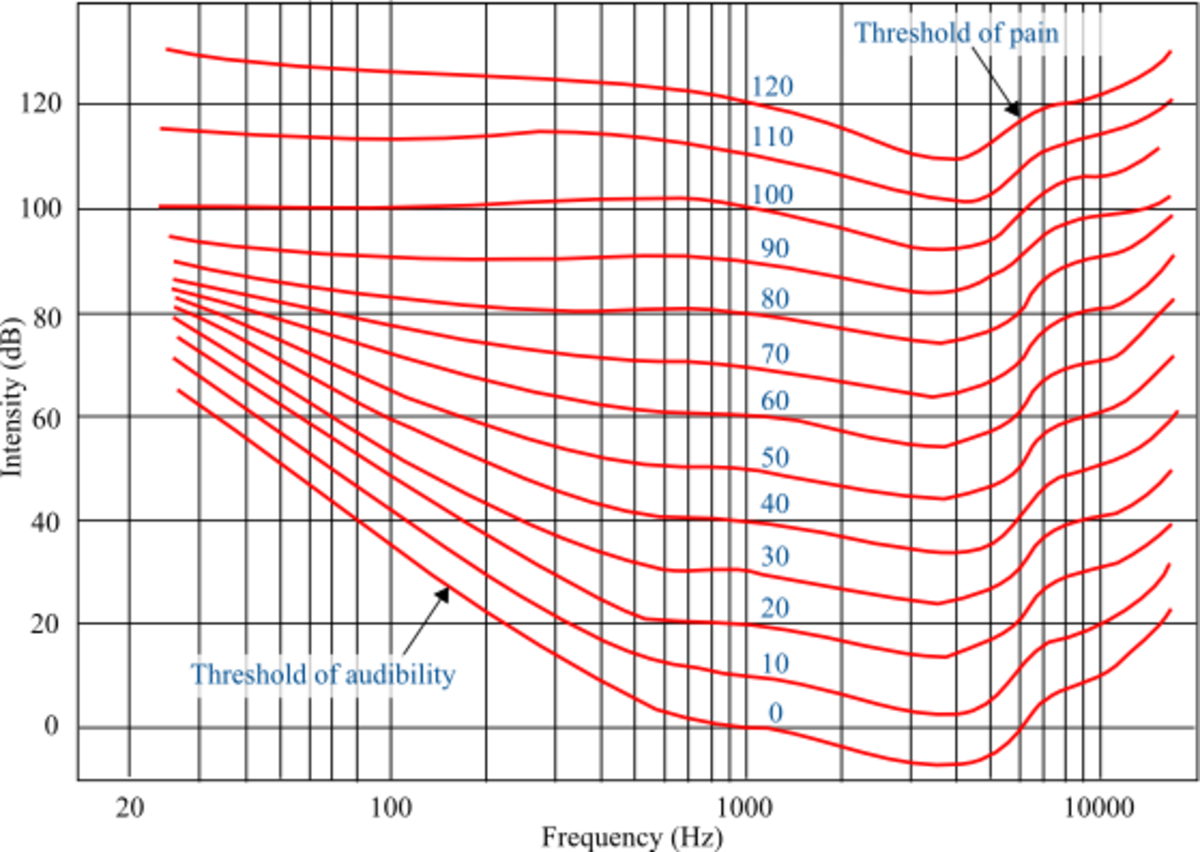
If a source which is vibrating at a constant frequency is made to vibrate at the same frequency but by a larger displacement, the extra power put into the source will produce larger pressure variations. This increase in pressure variations, which can be measured quantitatively, is interpreted by the ear as an increase in loudness. Loudness, however, is a perceived quantity and cannot be measured absolutely. How loud a source appears, therefore, depends upon the sound pressure level. It is also dependent upon the frequency; the ear perceives sound at about 4kHz to be much louder than the same Sound Pressure Level at 50Hz. The curve which passes through, say the 60dB line at 1kHz, is termed the “60 phon curve”.
Detectable and Acceptable Variations in Frequency Response
It was stated earlier that the frequency response of the ear extended from 20Hz to 20kHz. If audio which is bandwidth restricted to 30Hz and 15kHz is compared with the unrestricted audio, the two are, by most people, almost indistinguishable. It is therefore good practice to restrict a transmitted signal to these limits and then we only need to consider these frequencies. What is a detectable and what is an acceptable variation from the original sound source depends on many factors. The most important of which are:
who you are what references you have available
An experienced sound engineer will be able to hear errors that an average person will not notice. If you are unable to hear the original sound, it is more difficult to assess the quality of a reproduced sound.
Detectable and Acceptable Variations in Loudness
It is necessary when carrying out objective tests to define a measure of loudness. Since loudness depends on frequency, a weighting network can be used to approximate to the ears’ response. For most tests the frequency weighting network chosen is similar to the equal loudness curve for 40 phons (see above). Thus loudness can be measured in dBA, which is relative to 20µNm-2 via the A weighting network. The detectability of an abrupt change in level, for example, between two tracks of music, depends on experience. A sound engineer should be able to detect a 1dB change, whereas an average person might not not a 3dB change.
Dynamic Range
This is defined as the difference between the loudest part of a sound and the quietest part of the wanted sound. In an orchestra, this might be about 60dB and represents the variation between the loudest and quietest parts of the piece being played. In some cases, such as listening to a radio in a car, a wide dynamic range is undesirable, as the quietest parts might not be audible over the road noise, so audio can be compressed dynamically to 30dB, so that the variation between the loudest and quietest parts can be heard equally well, without increasing the volume excessively.
Behaviour of Sound Waves
The three most significant properties of sound waves that have to be taken into consideration when trying to predict their behaviour are:
reflection absorption refraction
It is important to consider the size of the wavelengths compared with the object that the sound is striking. As a guide, the frequency band can be broken up into three bands:
Reflected Waves
If a surface is hard, sound impinging on it will be reflected with little loss. If two such surfaces are separated by a distance which is half of one wavelength at a particular frequency, a standing wave can be set up. This gives rise to a high pressure at the walls where you can hear the note and very low pressure in the centre of the room where the note is barely audible.
Refracted Waves
If a sound wave is intercepted by an object whether the wave is reflected by it or is refracted around it will depend upon the relative size of the obstruction. For frequencies for which the obstruction is large (eg. greater than 10 wavelengths). the obstruction will reflect all of the wave. For frequencies where the obstruction is small (0.1%) it might as well not be there.
Absorbed Waves
If a sound wave hits a substance which is mechanically lossy and is sufficiently thick (in terms of wavelength), it will lose some of its energy and hence be reflected with a lower amplitude as part of the signal is absorbed. Because of the dimensions involved, high frequencies are more readily absorbed than lower frequencies.
Stereo Image
We perceive the position of sounds in everyday life by collating many pieces of information gather by our ears. Confirmation that our judgement is correct is given by our eyes and our experience. Some of the factors that enable us to locate with our two ears where the source of the sound came from are as follows:
time of arrival difference phase difference high frequency shadows amplitude difference
If the head is moved, a new set of readings are obtained, which can help us to identify the direction of the source. At different frequencies, the ears use different parameters to help with the source location. Where the source is music or speech, both of which contain a mixture of low, middle and high frequencies, all of the above techniques contribute to give very accurate positional location. An illusion of a two dimensional sound stage can be recreated by a pair of loudspeakers. By keeping constant all of the parameters except amplitude difference, the ears can interpret these amplitude differences as positional information. This content is accurate and true to the best of the author’s knowledge and is not meant to substitute for formal and individualized advice from a qualified professional. © 2022 Mr Singh