Filtering is the process of choosing a subset of your entire data set. Virtually any dimension (e.g., “Country” or “Sales Representative”) can be used as a Filter Control. Viewers of your report cannot make changes to the filters. Changes can only be made by the editor of the Report Before we add a second filter to the Report, let us add in a Bar Chart.
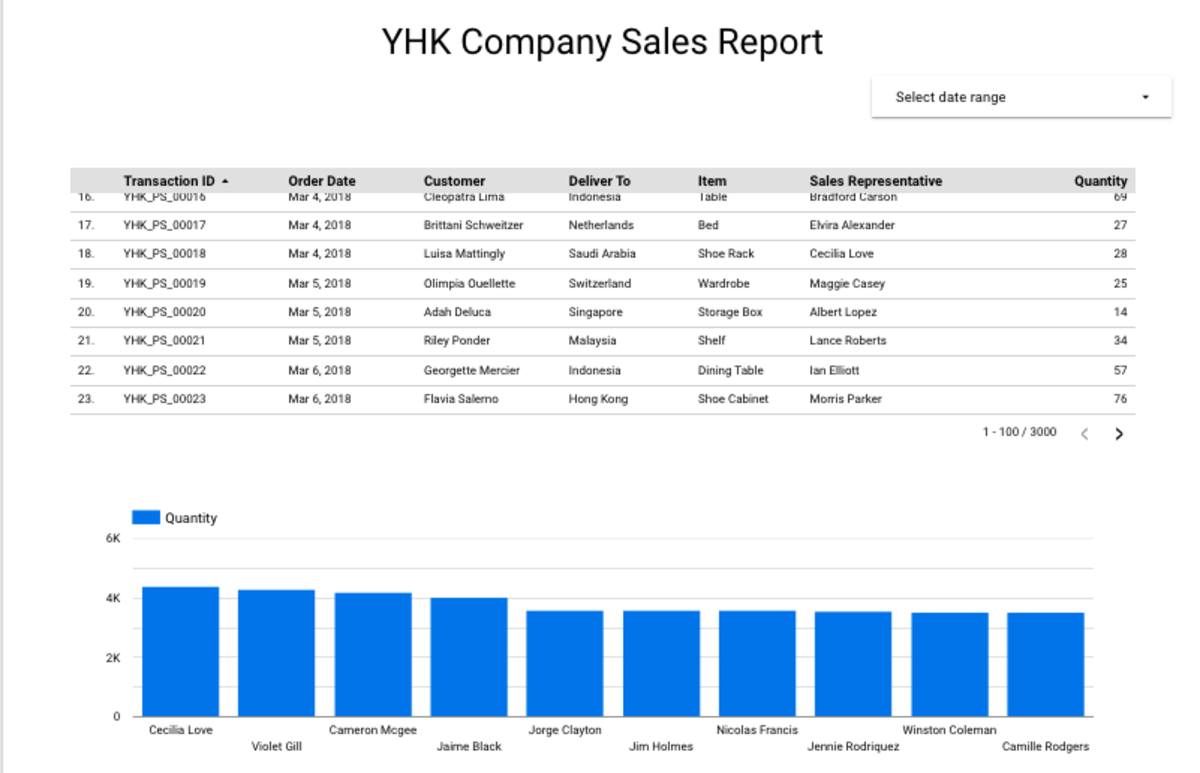
Dimension: Sales Representative Metrics: Quantity
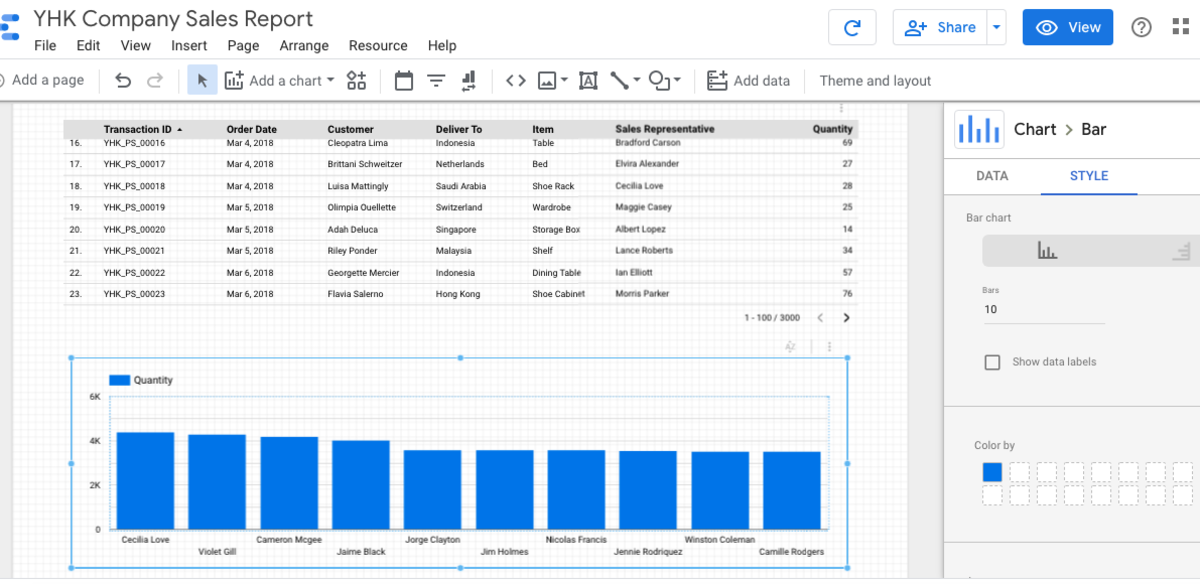
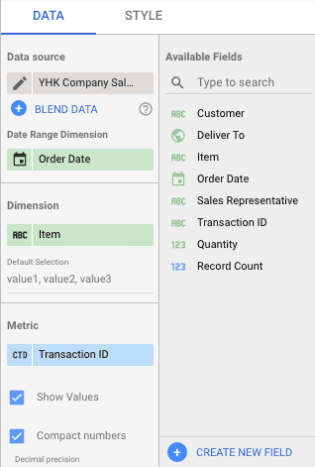
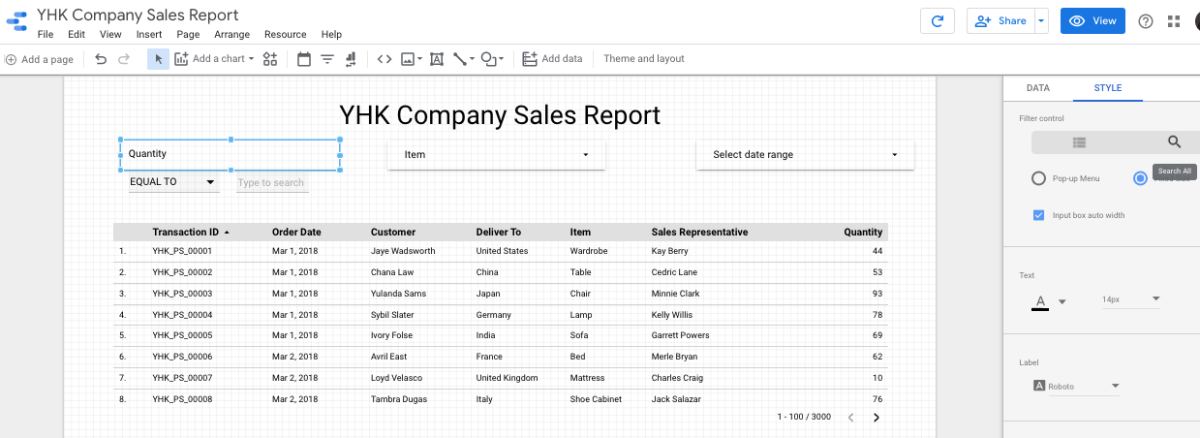
We want to show the top Sales Representatives of YHK Company by the number of products they sell. By default, Google Data Studio only shows the first 10 bars. If you wish to show more than 10, you need to configure this under the “Style” option of the visualisation. Delete “10” from the “Bars” option. Otherwise, leave it as 10. See below illustration. You wil notice that the total records shown in the Report still stay at 3000. The Table is still at its unfiltered view of the entire data. We are now ready to add another filter to our Report. Drag “Filter Control” to the Canva. Configure the filter as below:
Dimension: Item Metric: Transaction ID
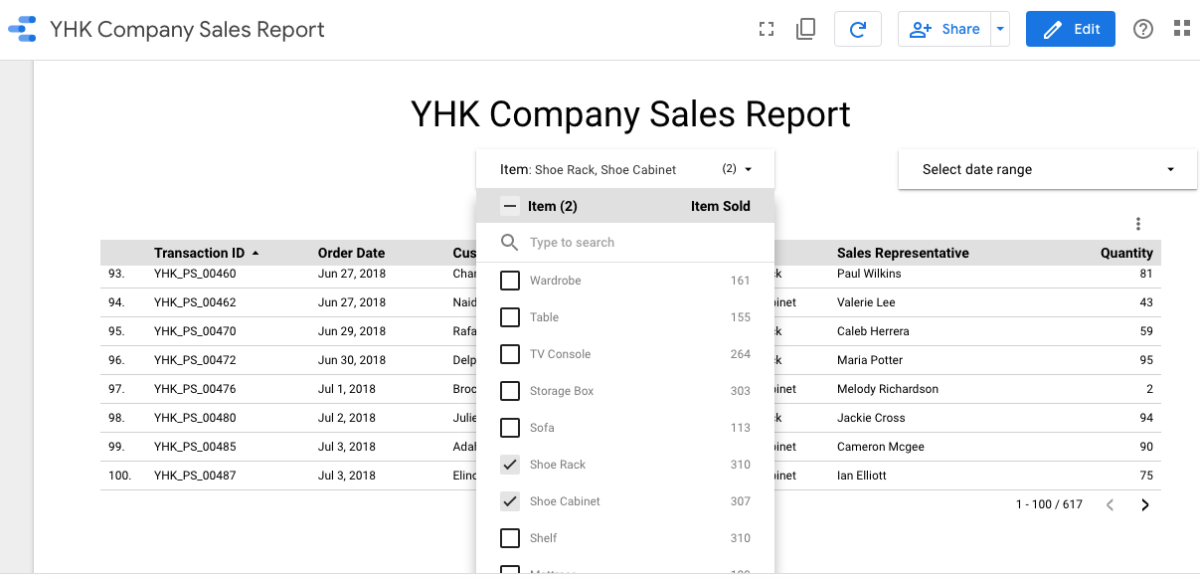
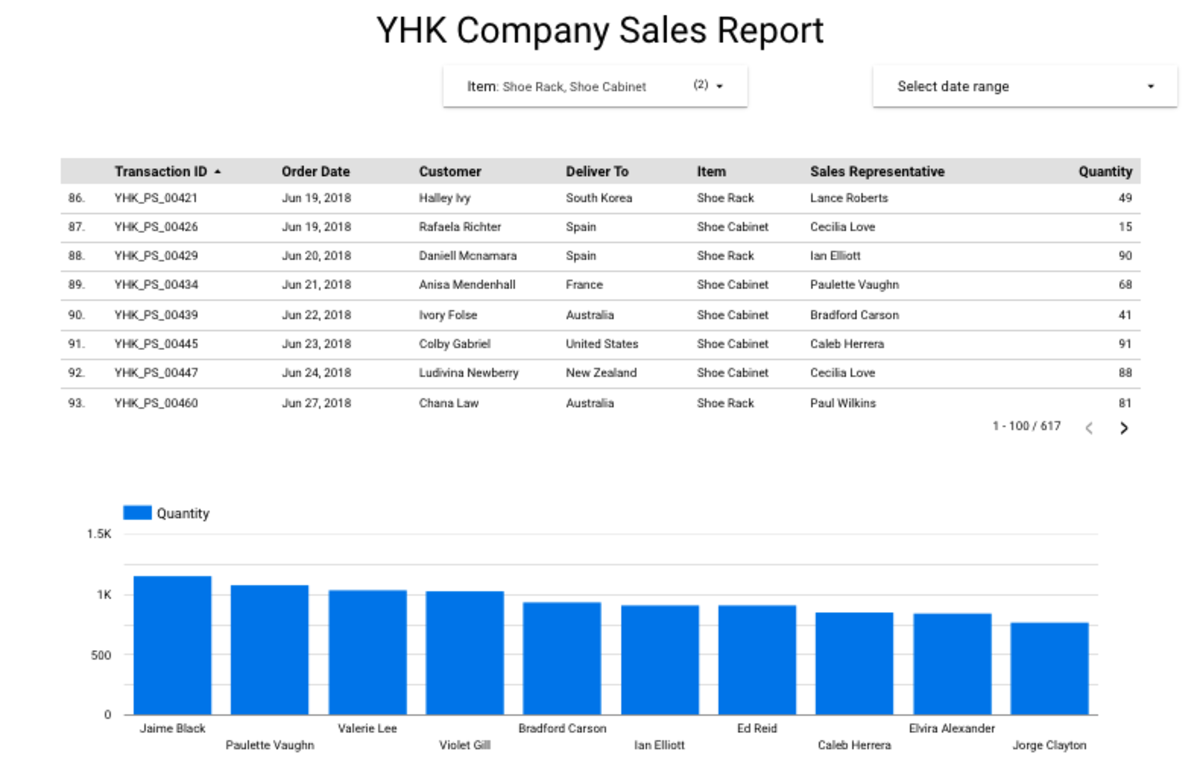
Click the “Pencil” icon on “Transaction ID”. Change Aggregation to “Count” and Rename to Item Sold Click “View” mode. Filter the Data to show only items sold as “Shoe Rack” and “Shoe Cabinet”. Note: Do not apply the Date Range filter.
Who’s The Top Seller?
For each question, choose the best answer. The answer key is below.
Answer Key
Need A Clue?
Scroll down and read from the illustration. You should be getting “Jaime Black” as the answer if you have been following my tutorial correctly.
Finishing Up Before We Go
Before we advance to the next article, add a third filter to the same Report. This time, to allow viewers to filter and view records with order quantity of more than 90 only. Drag the “Filter Control” button to the Canva as you would do normally. However, this time, we are going to do something different under the “Style” option. Change from “List” to “Search All” mode under Filter Control.
See It In Action!
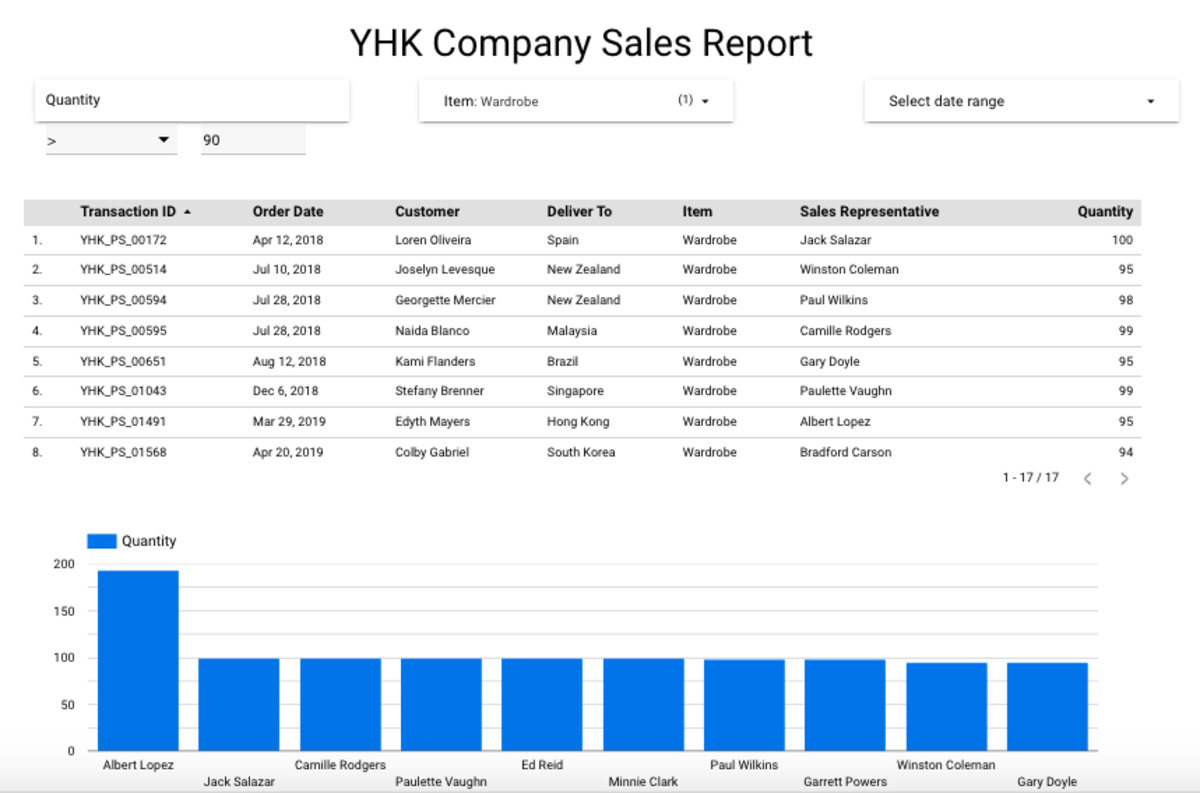
Click on “View” mode. Filter the data for records showing only with Item Quantity more than 90. Do you get the same result here?
What’s Next?
So far, we have looked at how you can use a filter to let viewers see only subsets of the data. Viewers can use the filter control to select one or more dimension values to filter the report. For example, a filter control based on the “Item” dimension lets viewers limit the records displayed in charts to only selected items, which, in this case, are Shoe Racks and Shoe Cabinets. The filter control makes your report more relevant to your audience giving them higher control over the data they see. In the next article, we will examine Chart interaction filters which will turn your charts into filter controls.
Navigation
Learn How to Use Google Data Studio to Visualise Data Easily Google Data Studio - Getting Started Data Connectors - Connect To Google Sheets Your First Visualisation Report using Google Data Studio Richer Interactive in Google Data Studio About Filter Control In Google Data Studio Using Charts as Interactive Filters in Google Data Studio Managing Data Sources in Google Data Studio This content is accurate and true to the best of the author’s knowledge and is not meant to substitute for formal and individualized advice from a qualified professional.